A Beginner's Guide to Chart Patterns in Trading
Chart patterns are visual representations of price movements on a chart that can help traders predict future price changes. They are important tools for traders, providing clues about the direction of a market. In this guide, we'll explore different types of chart patterns, how to recognize them, and what they might mean for trading.
What Are Chart Patterns?
Chart patterns are formations created by the price movements of a security on a chart. These patterns can signal whether the price is likely to continue in its current direction (continuation) or reverse (reversal).
Reversal Patterns
Reversal patterns suggest that the current trend might change direction. For example, if prices have been going up, a reversal pattern might indicate that they will start to go down.
Head and Shoulders

- What It Looks Like: This pattern has three peaks. The middle peak is the highest (head), with two lower peaks on either side (shoulders). The line connecting the bottoms of these peaks is called the neckline.
- What It Means: If the price drops below the neckline after forming this pattern, it could indicate a downtrend is beginning.
- Trading Tip: Watch for increased trading volume when the price breaks below the neckline, as this can confirm the trend change.
Inverse Head and Shoulders

- What It Looks Like: This is the opposite of the head and shoulders pattern. It features three troughs, with the middle one being the deepest.
- What It Means: It suggests that a downtrend could reverse into an uptrend if the price breaks above the neckline.
- Trading Tip: Look for high volume when the price moves above the neckline for confirmation.
Double Top and Double Bottom

- Double Top: Two peaks at about the same level, indicating a potential reversal from an uptrend to a downtrend.
- Double Bottom: Two troughs at a similar level, signaling a possible reversal from a downtrend to an uptrend.
- Trading Tip: Confirmation of these patterns often comes when the price breaks through key support (for double tops) or resistance (for double bottoms) levels.
Triple Top and Triple Bottom

- Triple Top: Three peaks at similar levels, reinforcing a potential downtrend.
- Triple Bottom: Three troughs, suggesting a stronger chance of an uptrend.
- Trading Tip: Breaks of support or resistance lines confirm these patterns, often alongside volume increases.
Rounded Top and Rounded Bottom

- Rounded Top: A smooth curve suggests the end of an uptrend.
- Rounded Bottom: A bowl shape hints at a reversal from a downtrend.
- Trading Tip: These patterns take longer to form, so patience is key.
Continuation Patterns
Continuation patterns indicate that the current trend is likely to continue after a pause.
Flag

- What It Looks Like: A small rectangle or parallelogram that forms after a strong price move.
- What It Means: A short pause before the price continues in the same direction.
- Trading Tip: Watch for breakouts in the original trend's direction with volume spikes for confirmation.
Pennant

- What It Looks Like: Similar to a flag, but with converging trendlines that create a small triangle.
- What It Means: Signals a pause followed by continuation of the prior trend.
- Trading Tip: Confirmation comes from volume and a breakout in the direction of the preceding trend.
Wedge

- What It Looks Like: A narrowing pattern that slopes upward or downward.
- What It Means: Can indicate continuation if it matches the current trend's direction.
- Trading Tip: Look for breakouts in the same direction as the original trend with volume support.
Key Differences
Shape: Pennants are small and symmetrical, while wedges are larger and have a distinct slope.
Trend Lines: Pennant trend lines converge to form a triangle, whereas wedge trend lines converge with an upward or downward slope.
Duration: Pennants are typically short-term patterns, forming over a few days to weeks. Wedges can develop over a longer time, often weeks to months.
Market Phase: Pennants occur during periods of consolidation after a strong trend. Wedges can indicate either continuation or reversal and are often seen at the end of a trend.
Triangle
- What It Looks Like: Formed by converging trendlines, can be ascending, descending, or symmetrical.
- What It Means: Ascending triangles are bullish, descending triangles are bearish, and symmetrical triangles can break either way.
- Trading Tip: Watch for breakouts with volume in the direction of the trend before the triangle formed.
Breakout Patterns
Breakout patterns suggest that a new trend might start after a period of consolidation.
Rectangle

- What It Looks Like: Price moves sideways between horizontal support and resistance levels.
- What It Means: A new trend is likely when the price breaks out of the rectangle.
- Trading Tip: Confirmation comes with a volume increase during the breakout.
Ascending and Descending Triangle

- Ascending Triangle: Flat top and rising bottom trendline, often leading to a bullish breakout.
- Descending Triangle: Flat bottom and descending top trendline, suggesting a bearish breakout.
- Trading Tip: Confirm breakouts with higher volume to anticipate new trends.
Symmetrical Triangle

- What It Looks Like: Converging trendlines of equal slope, creating a symmetrical shape.
- What It Means: The breakout direction is uncertain but indicates a new trend.
- Trading Tip: Wait for a strong breakout with volume to confirm the direction.
Other Notable Patterns
Cup and Handle

- What It Looks Like: A pattern that resembles a teacup, with a rounded bottom followed by a small consolidation.
- What It Means: Bullish continuation pattern that suggests an uptrend will resume after the handle forms.
- Trading Tip: A break above the handle with volume confirms the pattern.
Gaps
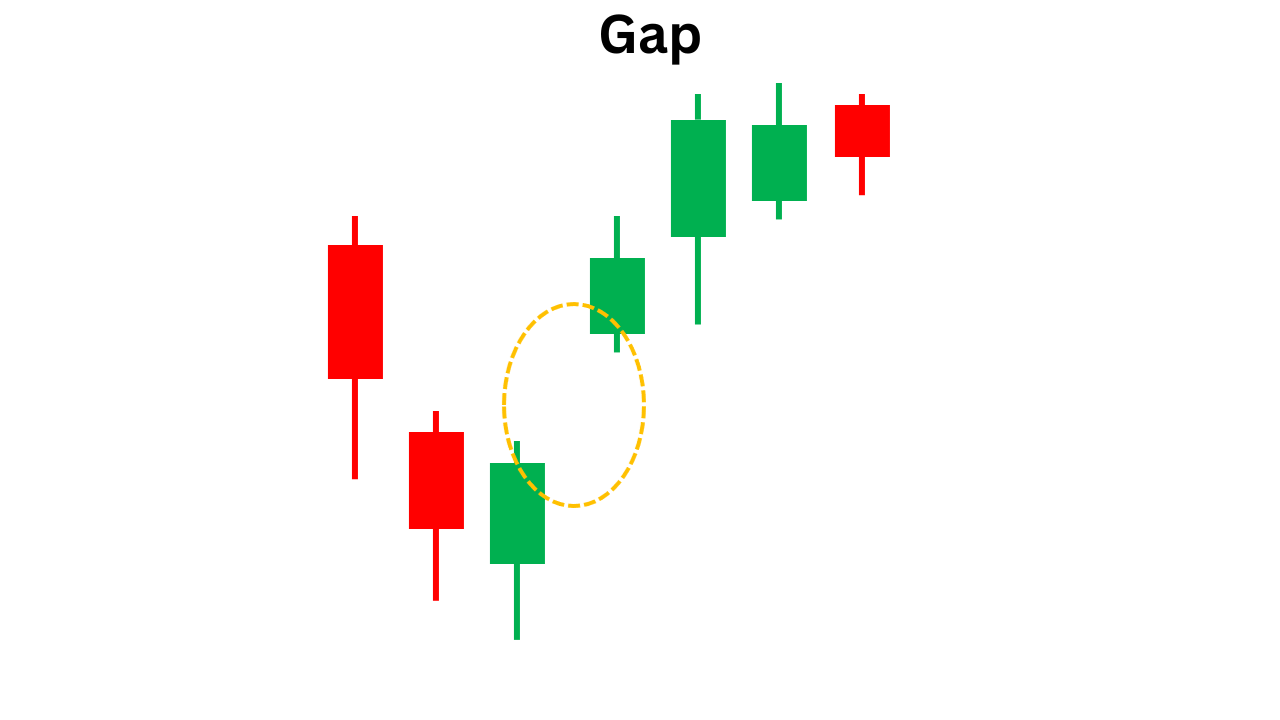
- What They Are: Occur when the price jumps with no trading in between, creating a gap on the chart.
- What They Mean: Often indicate strong market sentiment or news events.
- Trading Tip: Context and volume are crucial for interpreting gaps, as they can signal either continuation or reversal.
Falling and Rising Wedge

- Falling Wedge: Narrows downward, often signaling a bullish reversal.
- Rising Wedge: Narrows upward, typically indicating a bearish reversal.
- Trading Tip: Look for breakouts in the opposite direction of the wedge's slope with volume confirmation.


